
Inspector
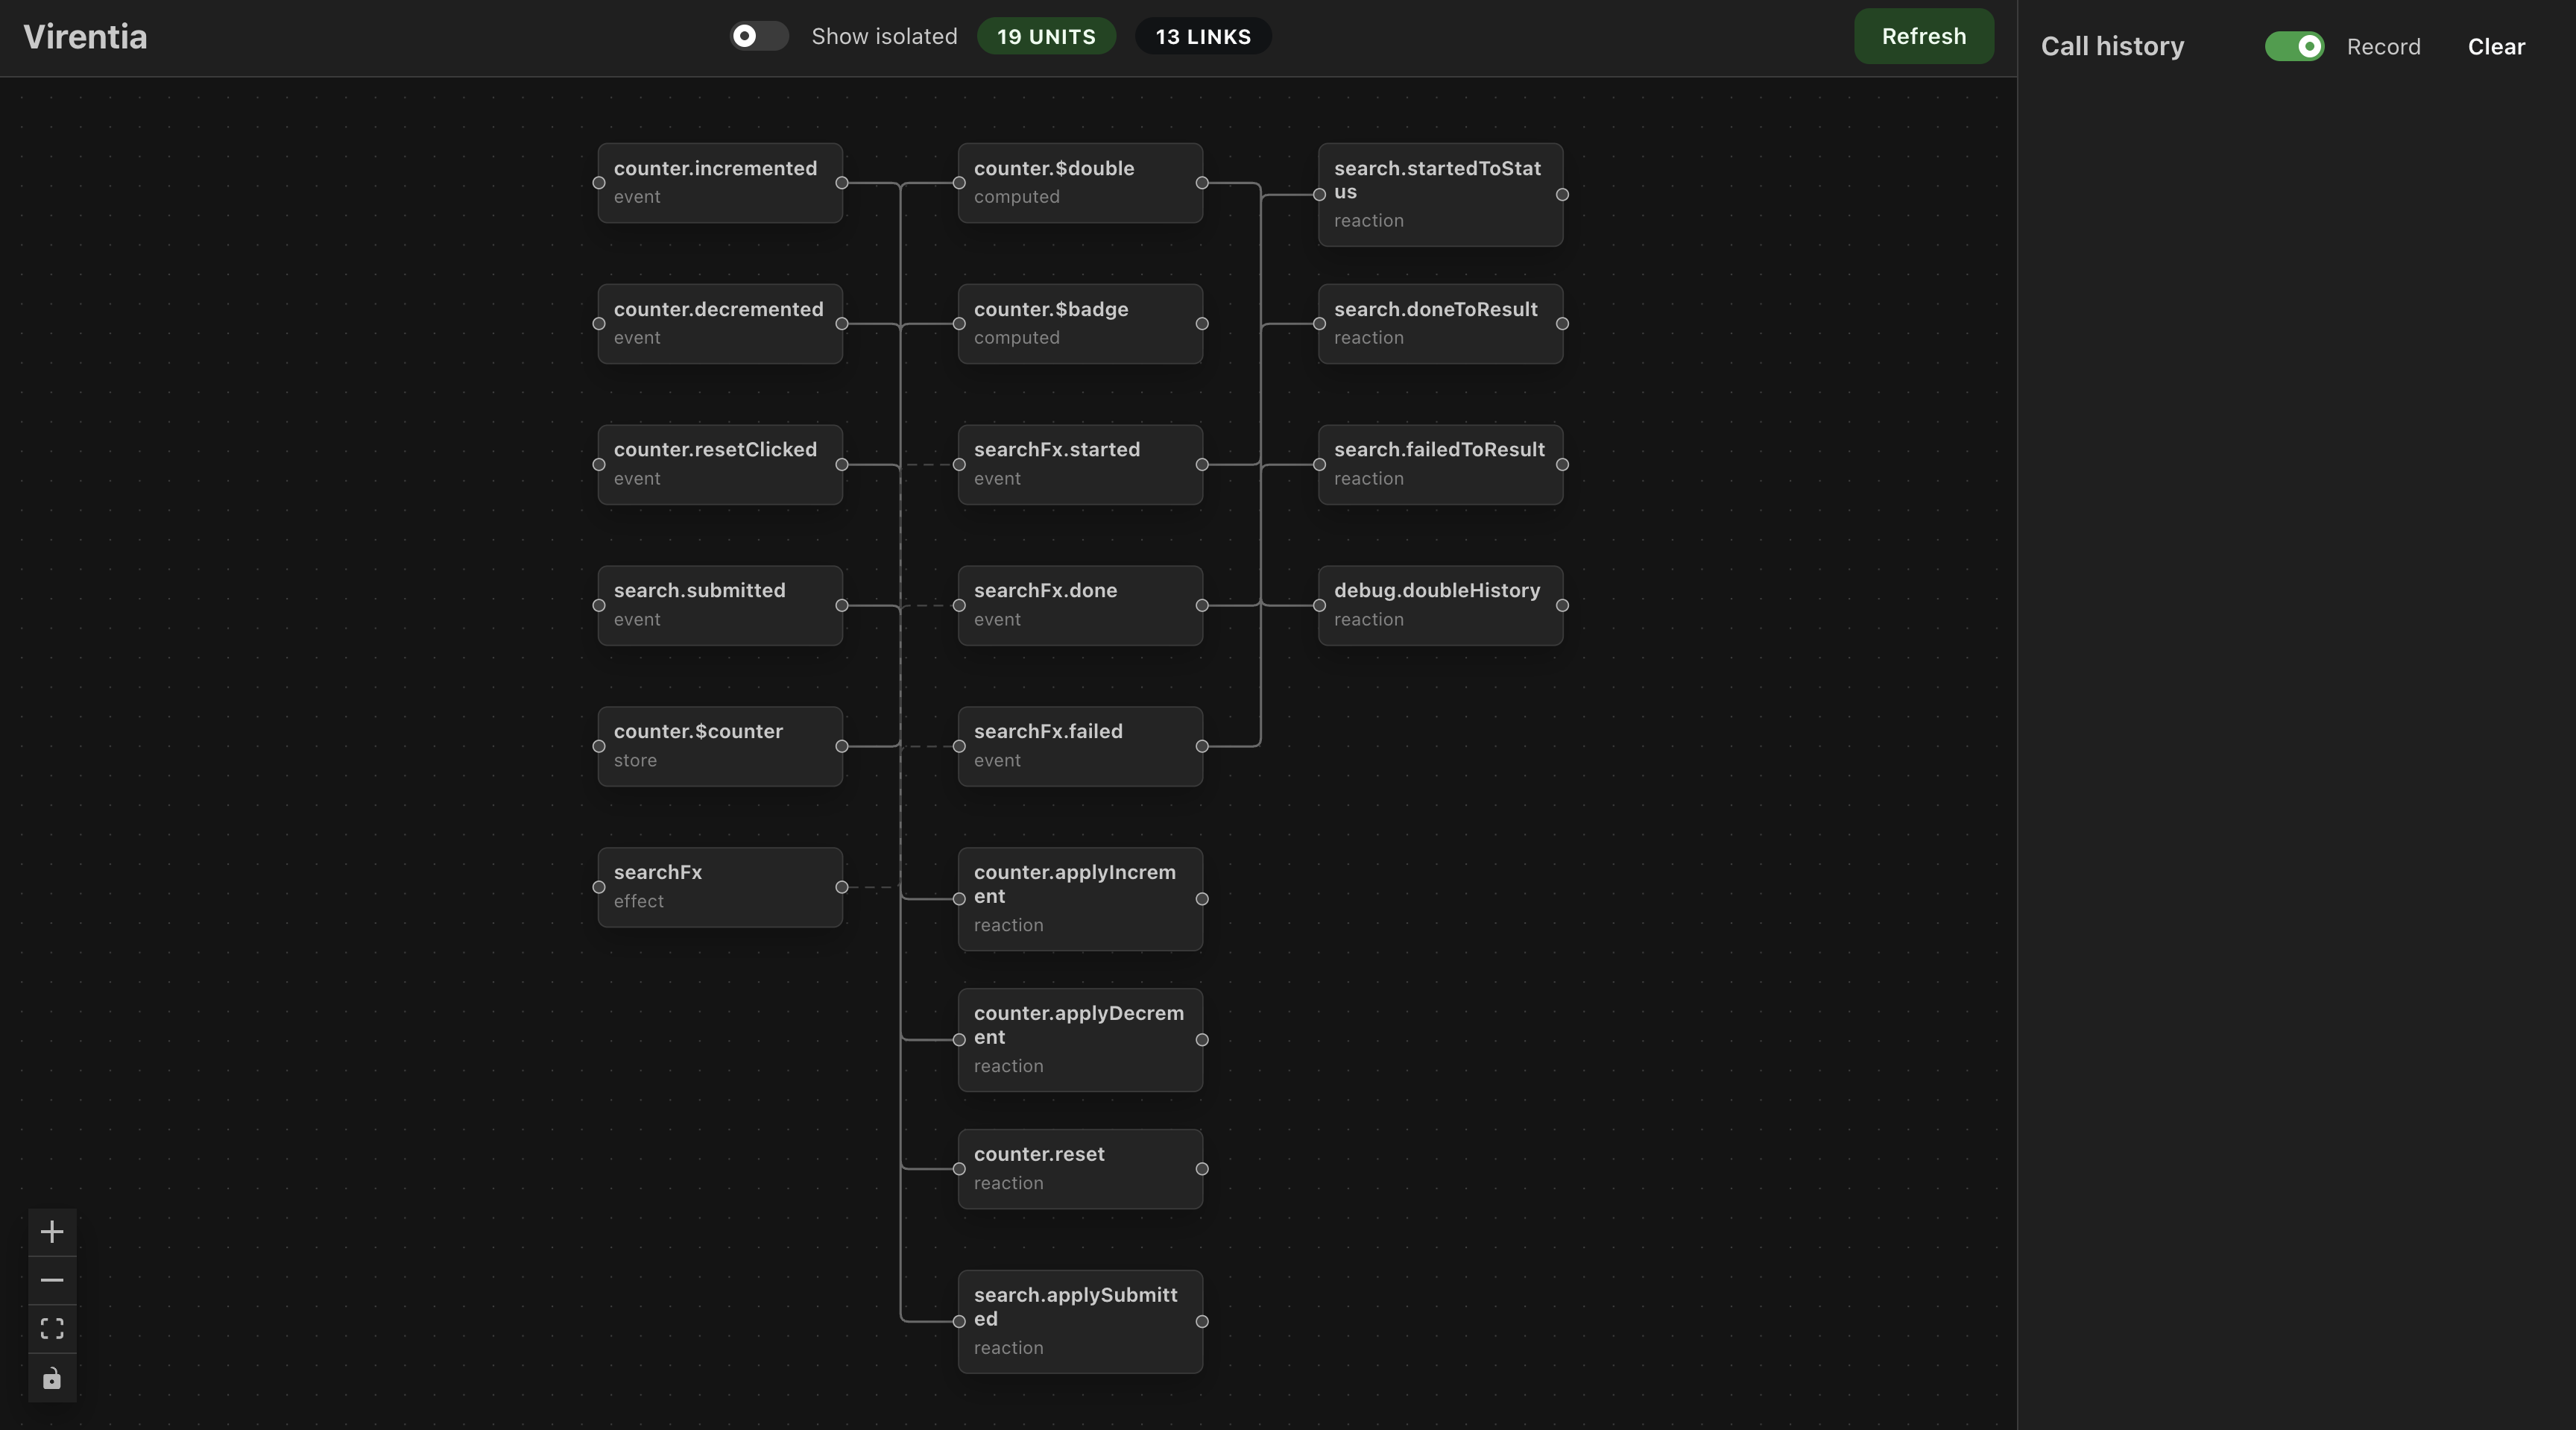
@virentia/inspector is a standalone devtools UI for Virentia models. It shows the runtime graph, scopes, payloads, results, durations, failed calls, stopped chains, and breakpoints without coupling the model to React or to a browser extension.
Use it while developing features, debugging model flow, or explaining how a model reacts to events. Do not ship it as part of a production bootstrap.
Install
Install the UI package in the app workspace:
pnpm add -D @virentia/inspectorRun the inspector:
pnpm exec virentia-inspectorBy default it serves the UI at http://127.0.0.1:5174/. The CLI also accepts:
pnpm exec virentia-inspector --open
pnpm exec virentia-inspector --port 5300
pnpm exec virentia-inspector --host 0.0.0.0 --port 5300
Connect an App
Connect the application from client-side development code:
import { installVirentiaDevtools } from "@virentia/core/devtools";

if (import.meta.env.DEV) {
  installVirentiaDevtools({
    appName: "Checkout",
    autoOpen: true,
  });
}
autoOpen opens the inspector window and passes the connection channel in the URL. If you open the page manually, go to http://127.0.0.1:5174/.
Use inspectorUrl when the inspector runs on another port:
installVirentiaDevtools({
  appName: "Checkout",
  inspectorUrl: "http://127.0.0.1:5300",
});
Use channel to isolate several apps or browser sessions:
installVirentiaDevtools({
  appName: "Checkout",
  channel: "checkout-local",
});
When you set a custom channel and open the inspector manually, include the same channel in the URL:
http://127.0.0.1:5174/?channel=checkout-localThe app and inspector communicate through postMessage, BroadcastChannel, and the CLI WebSocket relay at /__virentia_devtools. The relay is why the app can connect even when the inspector is a separate tab served from 127.0.0.1.
Connect from React Native or a Non-Browser Host
The bridge does not depend on window or BroadcastChannel, so it runs anywhere a WHATWG WebSocket exists — React Native, a web worker, Node, Deno, or Bun. Point inspectorUrl at the machine running the CLI relay, and run the CLI with --host 0.0.0.0 so the device can reach it over the network:
import { installVirentiaDevtools } from "@virentia/core/devtools";

if (__DEV__) {
  installVirentiaDevtools({
    appName: "Checkout",
    inspectorUrl: "http://192.168.1.10:5174", // the CLI host, reachable from the device
  });
}pnpm exec virentia-inspector --host 0.0.0.0 --port 5174If the runtime has no global WebSocket, or you need a custom transport, build one explicitly and pass it as transport:
import {
  createWebSocketTransport,
  installVirentiaDevtools,
} from "@virentia/core/devtools";

installVirentiaDevtools({
  appName: "Checkout",
  transport: createWebSocketTransport(
    "ws://192.168.1.10:5174/__virentia_devtools",
    { webSocket: MyWebSocket }, // inject a WebSocket constructor when there is no global one
  ),
});
createWebSocketTransport(url, options?) is a ready-made, runtime-agnostic transport with auto-reconnect and send buffering. url is the full WebSocket URL of the relay (the CLI listens on the /__virentia_devtools path). options accepts webSocket (a WebSocket constructor, e.g. the ws package), reconnectDelay, and maxQueue. createRelayTransport(inspectorUrl) builds the default relay transport from an HTTP URL and is what the bridge uses under the hood. Pass transport: null to disable the relay entirely and rely only on in-page transports.
Inspect an Effector App
The same inspector works with apps built on real effector. Connect from a separate bundle entry point instead of the Virentia bridge — no arguments required:
import { connectEffector } from "@virentia/inspector/effector";

if (import.meta.env.DEV) {
  connectEffector({ appName: "Checkout" });
}
connectEffector reads effector's own introspection (effector/inspect) and speaks the exact same wire protocol as installVirentiaDevtools, so the inspector UI and CLI are identical. It accepts the same appName, channel, inspectorUrl, and autoOpen options, returns a bridge with appId, channel, open(), sendGraph(), addUnits(), addScope(), snapshot(), and dispose(), and openEffectorInspector opens the window like openVirentiaDevtools.
The graph and timeline auto-discover units from inspectGraph (units created after connecting) and inspect (units that compute). Name your units (createStore(0, { name }), createEvent("name"), or the effector babel/swc plugin) for a readable graph.
Two optional inputs unlock the rest, because effector's public API cannot expose them: it has no global registry, inspectGraph is forward-only and returns no live node, and forked scopes are not enumerable.
import { connectEffector } from "@virentia/inspector/effector";
import { fork } from "effector";
import * as model from "./model";

const appScope = fork();

connectEffector({
  appName: "Checkout",
  units: [model.itemAdded, model.itemCount, model.loadPriceFx],
  scopes: [{ scope: appScope, name: "checkout tab" }],
});units— pass your model's units (or a module namespace's values) to get the full graph with edges immediately (walked from their live connections, including units created before connecting) and to trigger them from the inspector. Withoutunitsthe graph still lists discovered units, but as isolated vertices, and triggering needs a live unit reference.scopes— theforkscopes to observe in the timeline and to trigger units in. Scope-less computations are observed automatically; forked scopes must be passed (aScopedirectly or{ scope, name }, or add them later withaddScope).
Two Virentia-only inspector features have no effector equivalent and degrade gracefully instead of breaking:
- Breakpoints are accepted and shown, but never pause execution — effector has no chain-stop mechanism.
- Durations are reported as
0ms — effector's inspect stream carries no per-step timing.
Everything else — the reactive graph, the call timeline (one row per user-facing unit, with failures flagged), and triggering events and effects with a JSON payload — behaves the same as the Virentia flow.
Name the Graph
Readable names are the difference between a useful graph and a pile of anonymous nodes. Prefer naming units where they are created:
import {
  computed,
  effect,
  event,
  reaction,
  scope,
  store,
} from "@virentia/core";
import { nameScope, nameUnit } from "@virentia/core/devtools";

const appScope = scope();
nameScope(appScope, "checkout tab");

const itemAdded = event<{ id: string }>("cart.itemAdded");
const itemCount = store(0, undefined, { name: "cart.itemCount" });
const hasItems = computed(() => itemCount.value > 0, undefined, {
  name: "cart.hasItems",
});
const loadPriceFx = effect(
  async (id: string) => fetchPrice(id),
  "cart.loadPriceFx",
);

reaction({
  name: "cart.applyAddedItem",
  on: itemAdded,
  run(item) {
    itemCount.value += 1;
    void loadPriceFx(item.id);
  },
});

nameUnit(hasItems, "cart.hasItems");event(name), effect(handler, name), store and computed { name }, reaction name, nameUnit, and nameScope all feed the same inspector metadata. Named effect subunits such as started, done, and pending are grouped under the parent effect. Internal implementation nodes are hidden from the graph.
Use describeUnit when you need richer metadata:
import { describeUnit } from "@virentia/core/devtools";

describeUnit(loadPriceFx, {
  name: "cart.loadPriceFx",
  description:
    "Loads the current price for an item in the active checkout scope.",
});
Work with the Inspector
The main canvas shows visible units and links:
- solid links are reactive edges, meaning one unit can run the next unit;
- dashed links are ownership edges, such as effect lifecycle units under an effect;
- the
Show isolatedswitch reveals named units that are not currently connected to a visible chain; Refreshrequests a fresh graph snapshot from the app.
Click a node to highlight the related reactive chain. If the graph looks noisy, add names near model boundaries and hide isolated units while following one flow.
Timeline
The right panel records calls while Record is enabled. Each row shows the unit name, type, scope name, duration, payload preview, and result preview. Failed calls and stopped chains are marked separately, so you can see whether a handler threw, a filter stopped the chain, or a breakpoint interrupted the run.
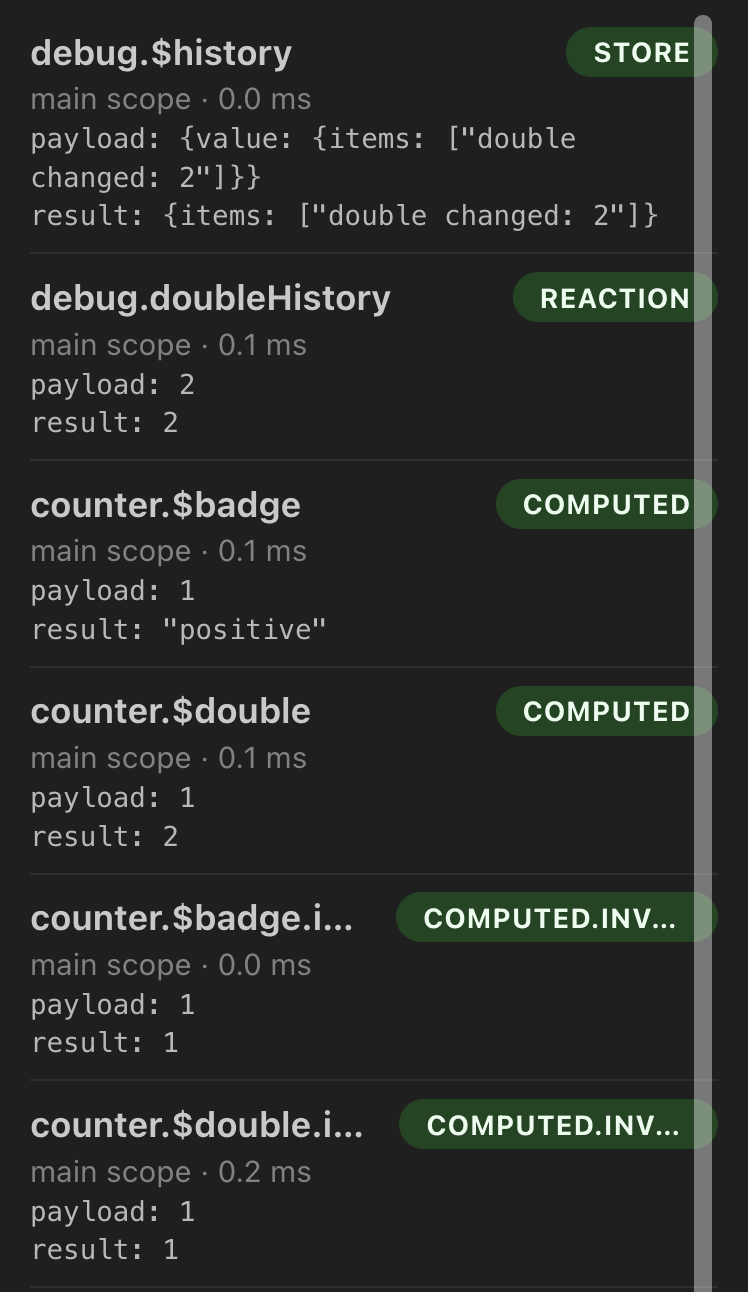
Use Clear to reset the visible history. Recording is only a UI toggle; it does not change how the app model runs.
Trigger Units
Right-click a callable node and choose Инициировать вызов to run it from the inspector. Events, stores, and effects expose callable nodes. The payload editor accepts JSON; an empty payload is sent as undefined.
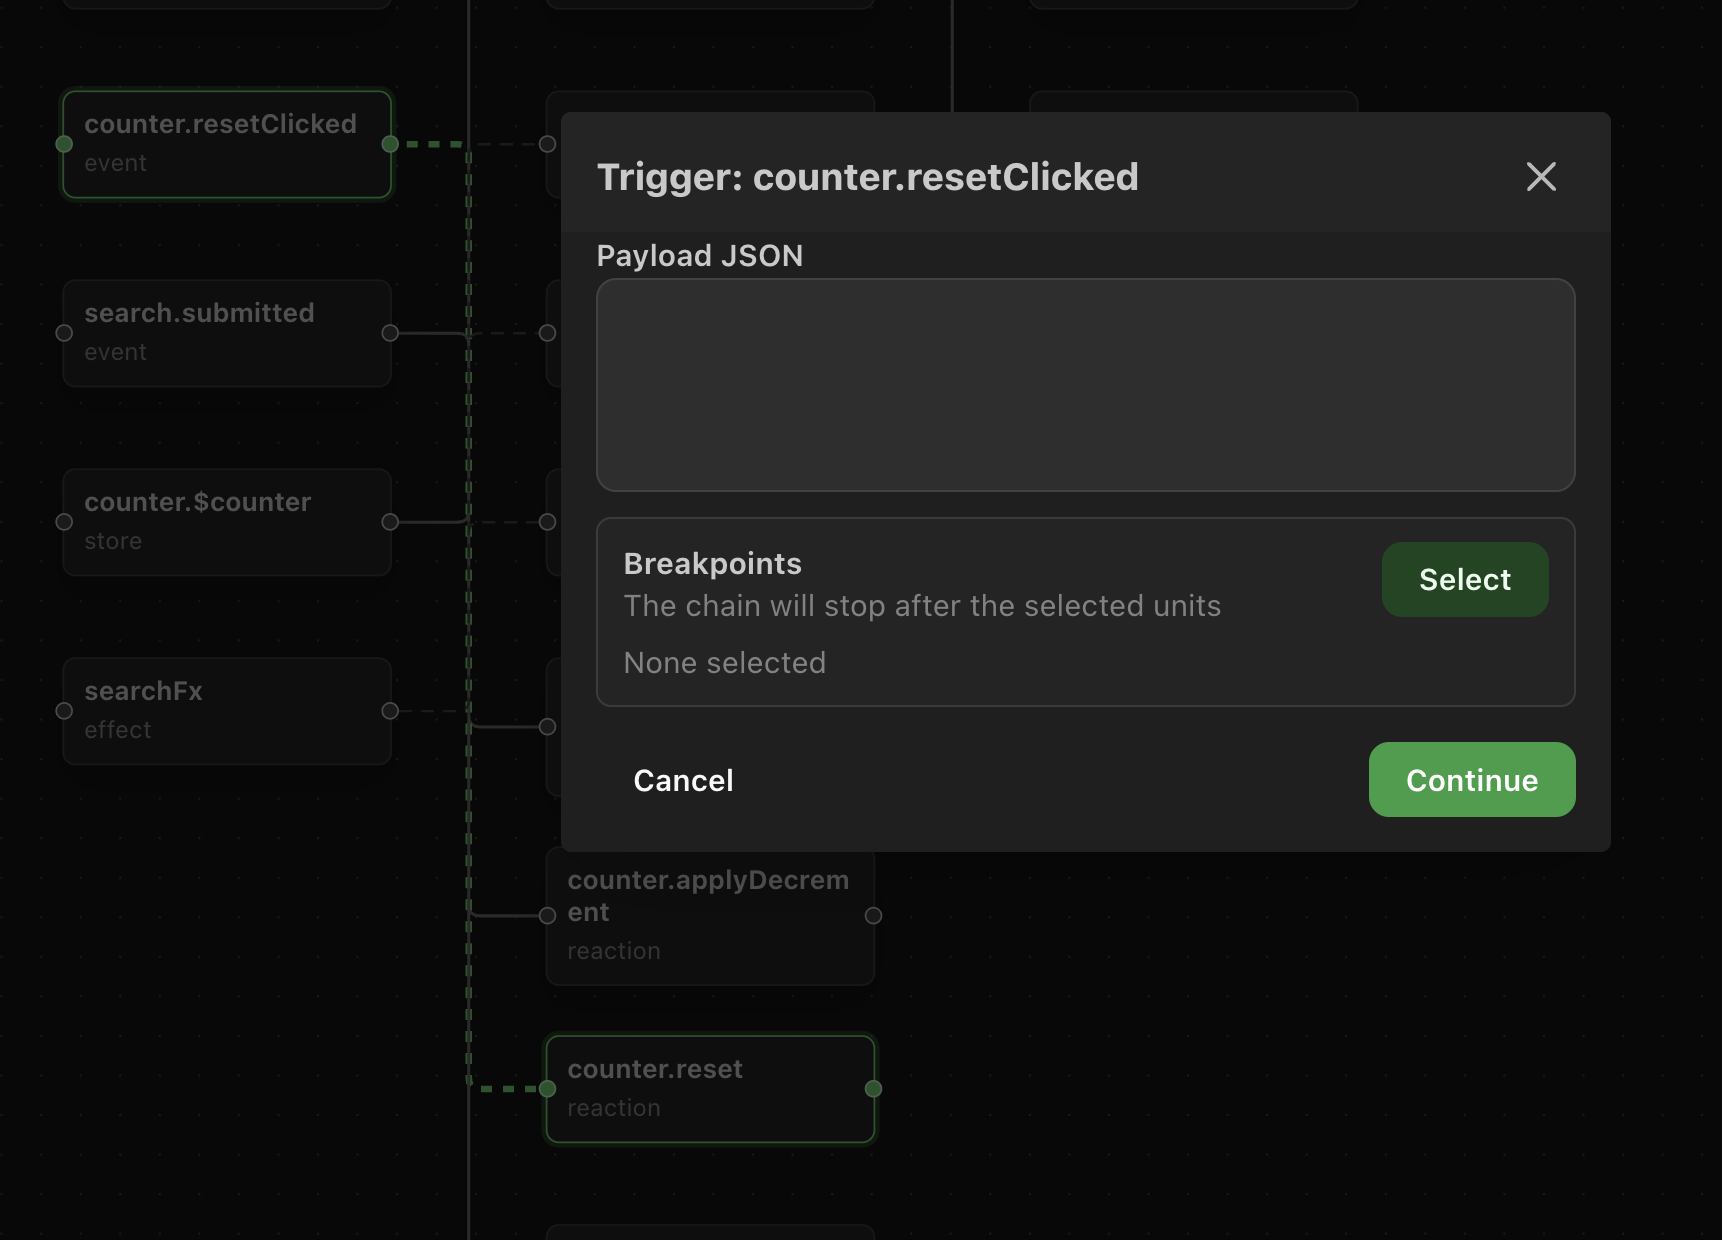
Before the call, you can choose breakpoints from the selected chain. The chain stops after a selected breakpoint node, then the previous breakpoint set is restored. Triggered calls execute real model code and real effects, so use safe payloads in development.
The current inspector triggers the first known scope from the connected app. Name your app scopes with nameScope so timeline rows make it clear where a call ran.
Programmatic Control
installVirentiaDevtools returns a bridge:
const devtools = installVirentiaDevtools({
  appName: "Checkout",
});

devtools.sendGraph();
devtools.setBreakpoints([]);
const snapshot = devtools.snapshot();

devtools.dispose();
Use dispose during tests, hot-reload teardown, or when a development-only bootstrap is unmounted. You can also call open() on the bridge to open the UI later.
For tests and low-level debugging, @virentia/core/devtools also exports getVirentiaDevtoolsSnapshot, setVirentiaDevtoolsBreakpoints, getDevtoolsNodeId, and getDevtoolsScopeId.
Troubleshooting
If the inspector shows 0 units, make sure the app called installVirentiaDevtools in the browser and that the inspector URL matches the CLI port.
If the app uses a custom channel, the inspector page must use the same channel query parameter. autoOpen: true handles this automatically.
If a trigger fails with Unknown scope, refresh the graph after creating the scope or run the app flow that registers it.
If names disappear after hot reload, prefer stable names at unit creation time. The inspector deduplicates stale named units and keeps the newest unit with the same type and name.